1881.
Eugenical
News 79
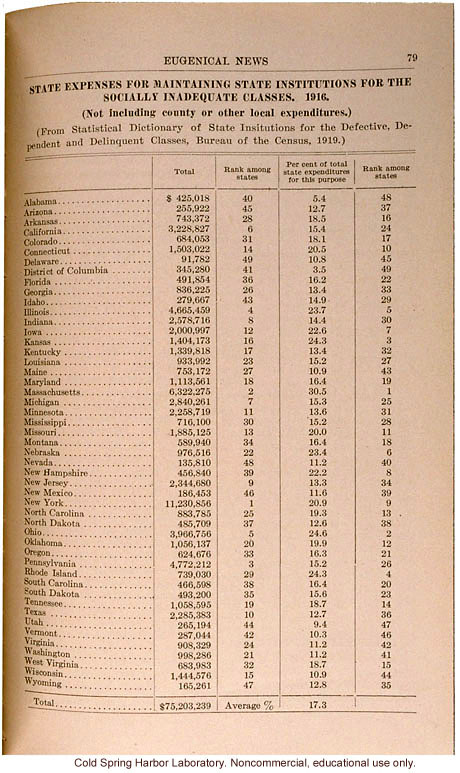
State
Expenses for Maintaining State Institutions for the Socially Inadequate Classes.
1916.
(Not
including county or other local expenditures.)
(From
Statistical Dictionary of State Institutions for the Defective, Dependent and
Delinquent Classes, Bureau of the Census, 1919.)
[double
hairline score]
Copyright 1999-2004: Cold Spring Harbor Laboratory; American Philosophical Society; Truman State University; Rockefeller Archive Center/Rockefeller University; University of Albany, State University of New York; National Park Service, Statue of Liberty National Monument; University College, London; International Center of Photography; Archiv zur Geschichte der Max-Planck-Gesellschaft, Berlin-Dahlem; and Special Collections, University of Tennessee, Knoxville.
The images and text in this Archive are solely for educational and scholarly uses. The materials may be used in digital or print form in reports, research, and other projects that are not offered for sale. Materials in this archive may not be used in digital or print form by organizations or commercial concerns, except with express permission.
| |
Total
|
Rank
among states
|
Per
cent of total state expenditures for this purpose
|
Rank
among states
|
|
Alabama
. . .
|
$425,018
|
40
|
5.4
|
48
|
|
Arizona
. . .
|
255,922
|
45
|
12.7
|
37
|
|
Arkansas
. . .
|
743,372
|
28
|
18.5
|
16
|
|
California
. . .
|
3,228,827
|
6
|
15.4
|
24
|
|
Colorado
. . .
|
684,053
|
31
|
18.1
|
17
|
|
Connecticut
. . .
|
1,503,022
|
14
|
20.5
|
10
|
|
Delaware
. . .
|
91,782
|
49
|
10.8
|
45
|
|
District
of Columbia . . .
|
345,280
|
41
|
3.5
|
49
|
|
Florida
. . .
|
491,854
|
36
|
16.2
|
22
|
|
Georgia
. . .
|
836,225
|
26
|
13.4
|
33
|
|
Idaho
. . .
|
279,667
|
43
|
14.9
|
29
|
|
Illinois
. . .
|
4,665,459
|
4
|
23.7
|
5
|
|
Indiana
. . .
|
2,578,716
|
8
|
14.4
|
30
|
|
Iowa
. . .
|
2,000,997
|
12
|
22.6
|
7
|
|
Kansas
. . .
|
1,404,173
|
16
|
24.3
|
3
|
|
Kentucky
. . .
|
1,339,818
|
17
|
13.4
|
32
|
|
Louisiana
. . .
|
933,992
|
23
|
15.2
|
27
|
|
Maine
. . .
|
753,172
|
27
|
10.9
|
43
|
|
Maryland
. . .
|
1,113,561
|
18
|
16.4
|
19
|
|
Massachusetts
. . .
|
6,322,275
|
2
|
30.5
|
1
|
|
Michigan
. . .
|
2,840,261
|
7
|
15.3
|
25
|
|
Minnesota
. . .
|
2,258,719
|
11
|
13.6
|
31
|
|
Mississippi
. . .
|
716,100
|
30
|
15.2
|
28
|
|
Missouri
. . .
|
1,885,125
|
13
|
20.0
|
11
|
|
Montana
. . .
|
589,940
|
34
|
16.4
|
18
|
|
Nebraska
. . .
|
976,516
|
22
|
23.4
|
6
|
|
Nevada
. . .
|
135,810
|
48
|
11.2
|
40
|
|
New
Hampshire . . .
|
456,840
|
39
|
22.2
|
8
|
|
New
Jersey . . .
|
2,344,680
|
9
|
13.3
|
34
|
|
New
Mexico . . .
|
186,453
|
46
|
11.6
|
39
|
|
New
York . . .
|
11,230,856
|
1
|
20.9
|
9
|
|
North
Carolina . . .
|
883,785
|
25
|
19.3
|
13
|
|
North
Dakota . . .
|
485,709
|
37
|
12.6
|
38
|
|
Ohio
. . .
|
3,966,756
|
5
|
24.6
|
2
|
|
Oklahoma
. . .
|
1,056,137
|
20
|
19.9
|
12
|
|
Oregon
. . .
|
624,676
|
33
|
16.3
|
21
|
|
Pennsylvania
. . .
|
4,772,212
|
3
|
15.2
|
26
|
|
Rhode
Island . . .
|
739,030
|
29
|
24.3
|
4
|
|
South
Carolina . . .
|
466,598
|
38
|
16.4
|
20
|
|
South
Dakota . . .
|
493,200
|
35
|
15.6
|
23
|
|
Tennessee
. . .
|
1,058,595
|
19
|
18.7
|
14
|
|
Texas
. . .
|
2,285,383
|
10
|
12.7
|
36
|
|
Utah
. . .
|
265,194
|
44
|
9.4
|
47
|
|
Vermont
. . .
|
287,044
|
42
|
10.3
|
46
|
|
Virginia
. . .
|
908,329
|
24
|
11.2
|
42
|
|
Washington
. . .
|
998,286
|
21
|
11.2
|
41
|